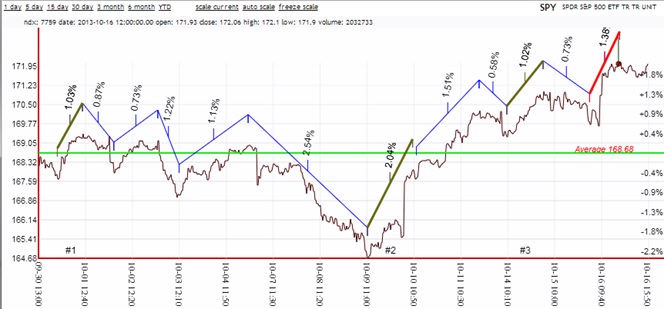
Chart showing SPY data moves over weeks prior to October 16 with key inflection points shown.

Consulting, Machine Learning, Predictive Engines
Quantized ML Classifier, Elastic Search, Lucene, Product Search, Enterprise Search, Auto Suggest.
Chart showing SPY data moves over weeks prior to October 16 with key inflection points shown.