
Forex Micro Strategies available for sophisticated users
I recently started making Forex Micro-strategies available for sophisticated users under the general terms that they agree to pay 15% of their net profit. Those that pay will also gain the benefit of continued enhancements and new micro strategies. Contact us for access.
The most common question:
“How Accurate is the Strategy?”
I could state the strategy was 93% accurate or it won 93% of the time but this would be misleading because it is true for specific conditions over a specific range of time. The same strategy with minor configuration changes can reach higher accuracy but lower net profit or different changes could result in a lower accuracy. As shown in the samples below a 93% accurate strategy configuration delivered 500% more net profit than a 100% accurate configuration. It also delivered enough additional trades to be more confident in using it for forward looking trading. The accuracy is misleading because each user is responsible for their own configuration. You also need to understand the magnitude of the wins versus the losses. You can have a 90% win rate with a few very large losses and still produce a net loss.
In the end we are seeking to maximize net profit while minimizing draw downs. As explained below, we depend on the law large numbers to predict future performance even-though we know that historical performance can never guarantee a identical future performance it should give an indication for similar performance.
The ultimate answer requires a deeper conversation because it is ultimately a trade off between multiple factors such as Trade Frequency, Trade Accuracy, Net Profit, Draw downs, Consecutive losses, commission costs and compounding. There is no perfect answer but there are answers that work better for a given user.
Why is the Law of Large #’s important
The law of large # is important because we are using it to imply that if we can make a profit against a sufficiently large number of trades using back-tests that we have a better change of making a profit using the same settings for live trading. This assertion must hold true for our customers to make a long term profit using micro-strategies for trading.
Drop an egg once and have it break and you have an observation.
Drop an egg twice and have it break then you suspect trend.
Drop an egg 10 times and have it break and you confirm a trend.
Drop an egg 30 times and see it break and you suspect a new law.
The law of large numbers can be reversed to say that if you perform an experiment a sufficient number of times and observe consistent results then you can use those results to predict the result of the next experiment when you perform it under the same or similar conditions. You will not be 100% correct but we are only looking for a statistical edge.
Results from Early Live Cash Trading
My intent for showing results from our micro-live test of a 90 day optimization strategy is to compare the Back-test results to the live trading results showing how the back-test sample appears to be able to predict approximate success rates in forward looking trading. If our assertions are correct we should see a similar win / loss rate for our live cash tests as we do from our back-tests.
Live Trading Results: 19 Trades, 12 wins for a 63% win rate. Trading against a starting capital of $246 a profit of $5.18 represents 2.1% gain or (0.15% per day) Trades where limited to 1% of capital at risk.
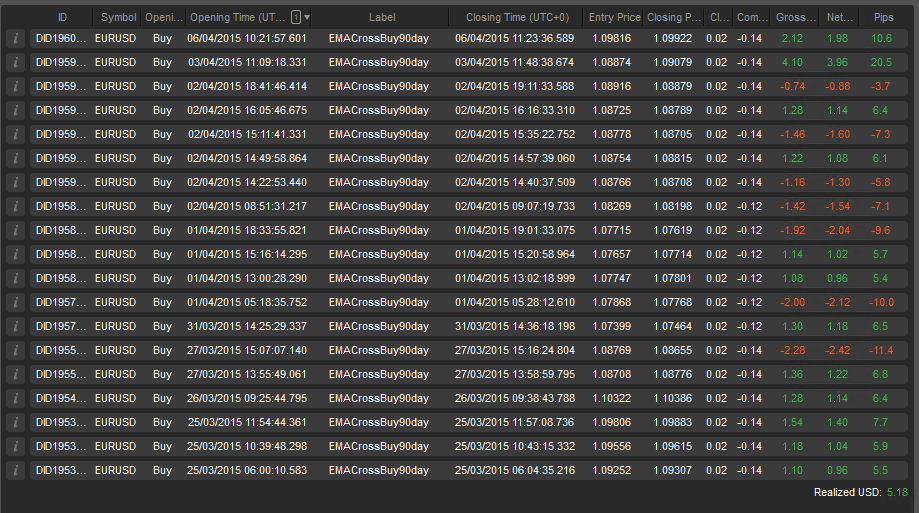
Back-test Trading results: 14 Trades, 8 wins for a 57% win rate. Net profit of $17.2 against starting capital of $1,000 represents a 1.72% gain (0.143% per day). Based on this a 15% variance from a 57% win rate would give us a range from 46.8% to 65.6%.
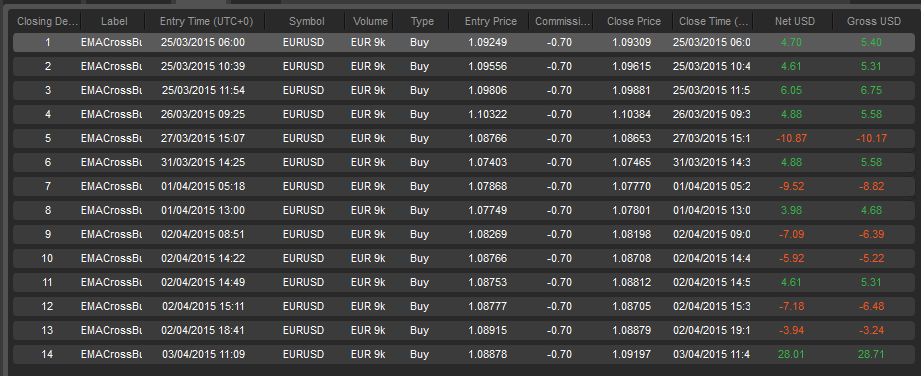
Back-tests in cAlgo can not start with less than 1,000 so we have to adjust the results proportionally to reflect the fact that the live tests only had about $250 to start. Tick data for back tests in cAlgo are only delayed for a couple days in cAlgo so the live trading has two more days than the back test.
As we can see the live trading with a 63% win rate was 6% higher than what the back-test predicted and the back-test profit of 1.72% gain yielded 0.007% less per day than the live trading. I think this is pretty good alignment.
As I mention below the larger the number of trades we have in both sample sets the closer the two samples should converge providing the fundamental trading conditions do not change.
The results from by comparing the first 14 live trades is promising but we need to confirm across a longer period of time to ensure it was not luck. As described below we continually test and cycle back to ensure that our results remain favorable.
Note: I modified the configuration few times during this period and added more sophisticated longer term trend detection. For this to be a true test we would need to start over and change nothing. It is always a balancing act between valid comparable test results and implementing features or configuration changes you believe will make it better. The Long term trend detector was targeted at eliminating some bad trades like those on April-2nd. It is possible that the changes applied to the live trading caused a portion of the difference between the back-test and the live trading results.
Since I am running multiple tests in the live account simultaneously we can not show some screens because they don’t provide the ability to separate the trades by label.
Live Cash Trades Week April-5th
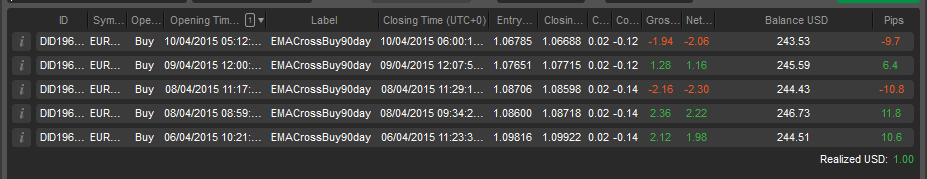
This was a interesting week with a mostly down movement over 330 pip where you would expect long only strategies to struggle. The long only strategy produced an average of 0.08% per day while maintaining a 60% accuracy rate that is inside the range of 48% to 66% we expect from the back-test.
The profit per day 0.08% is only 56% of the 0.143% projected by the back-test but it is expected and desirable to see a long only strategy trade fewer times due to unfavorable market conditions.
I prefer weeks with over 20 trades because it gives us greater confidence in the results via the large of large numbers. With this few of trades a single winning or loosing trade can have too large of an impact on the outcome. For strategies that trade this seldom we have to look at the results across a longer period of time to gain confidence.
Looking a little further back
We shouldn’t just test against the same time frame although it does produce useful output. To really compare our assertion we must predict for a equivalent period before we started our test and see how it compares to the live results.
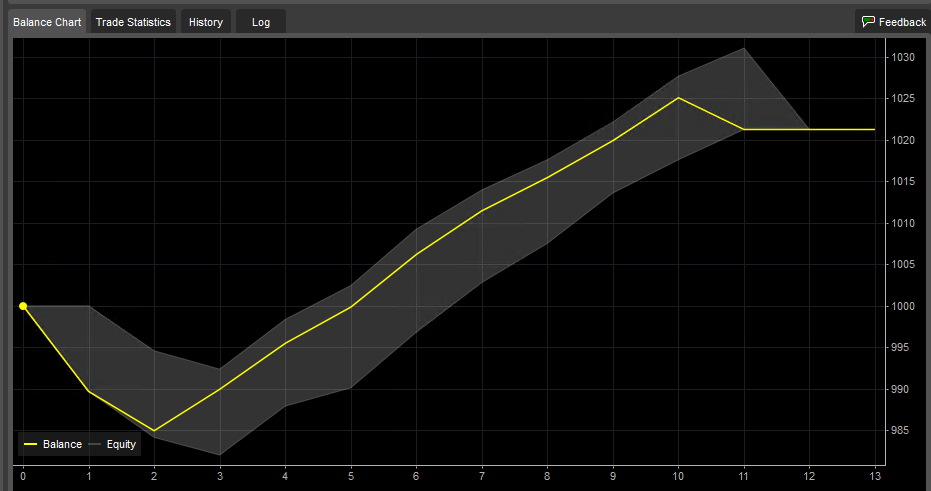
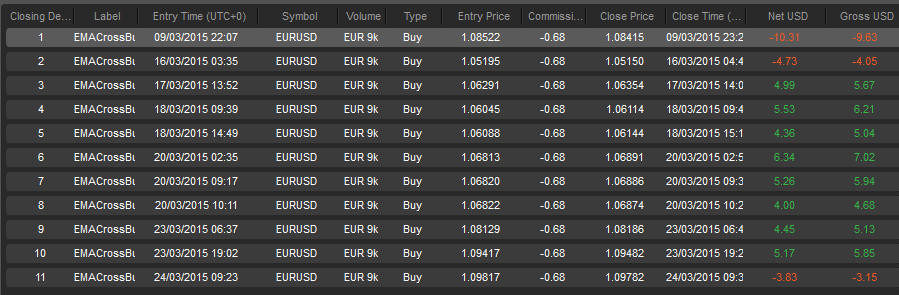
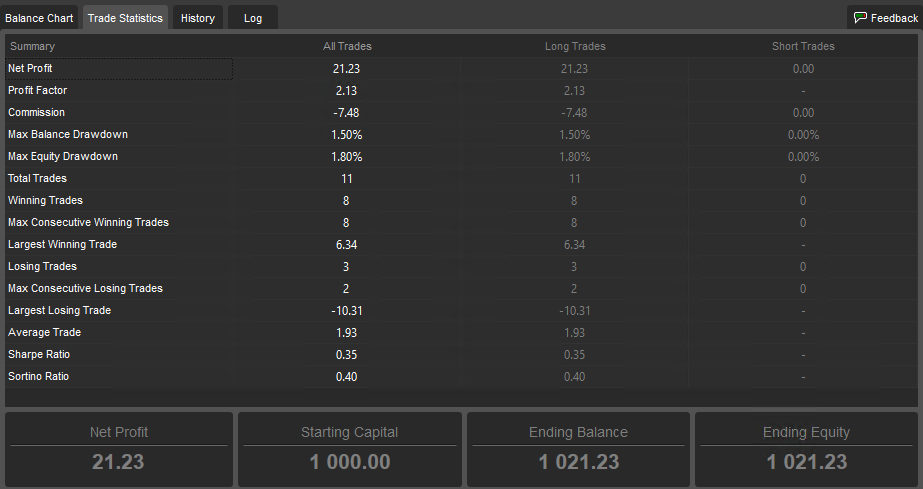
For the time frame March-8 to March-24 we have 11 trades with 8 wins for a 72% win rate. With $21.23 in net profit or 2.12% (0.125% per day). This time the back test has a win rate 9% above the live test while the profit per day is 0.025% lower than the live test.
Exception Periods
There will always be exceptions where the market conditions are particularly friendly for the strategy or the reverse where the strategy is not capable of properly coping with the market conditions but with enough of these samples the average should converge. A perfect example of a overly friendly market is the period from Feb-24 through March-7 the strategy made 6 trades all wins for a 4.37% gain nearly double what we saw form the other back test periods.
Testing over 125 day period of time
A longer period of time the back-test from Dec-1-2014 through Apr-5-2015 made 101 trades with 60 wins for a 59% win rate. During this 125 days it made a net profit of $170.48 or 17% (0.136% per day) which places it 0.014% per day lower than what we measured from the live cash trading. I think this is a remarkably good match but we will need more data before considering it conclusive.
NOTE: This strategy was optimized against a 90 day time frame with the assumption that it would be re-optimized at least once every couple of weeks using the most recent data for the most recent 90 day time frame.
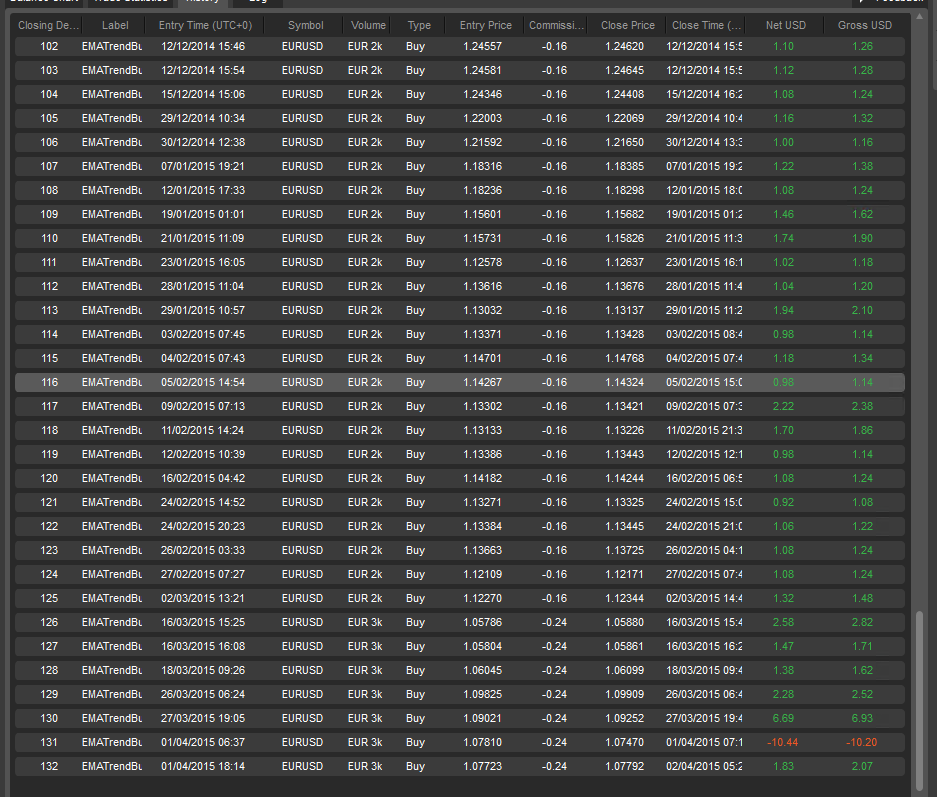
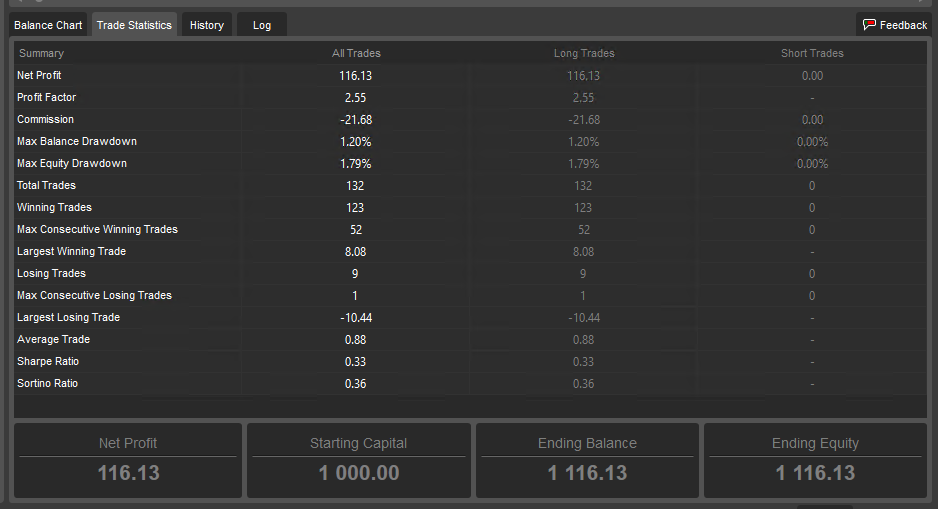
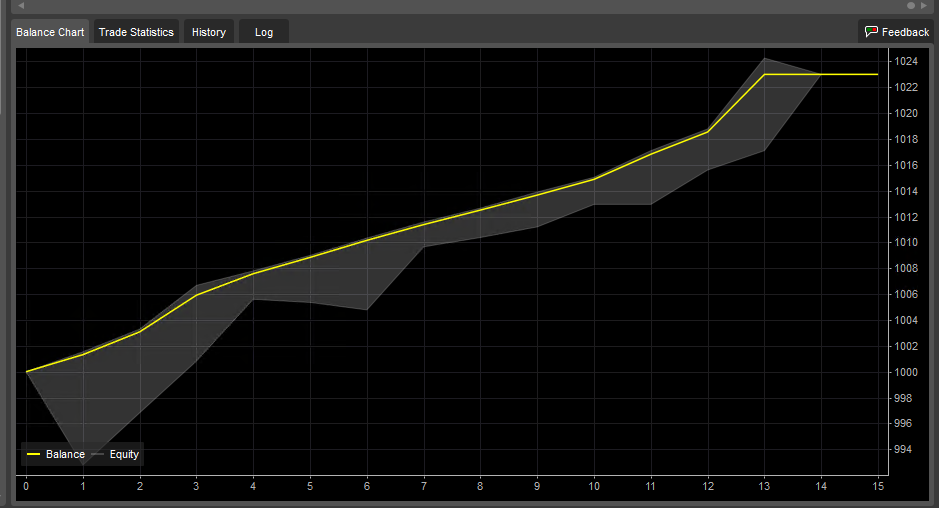
Sample of 93% correct predictions with More Trades and 500% higher Net profit than tighter filter.
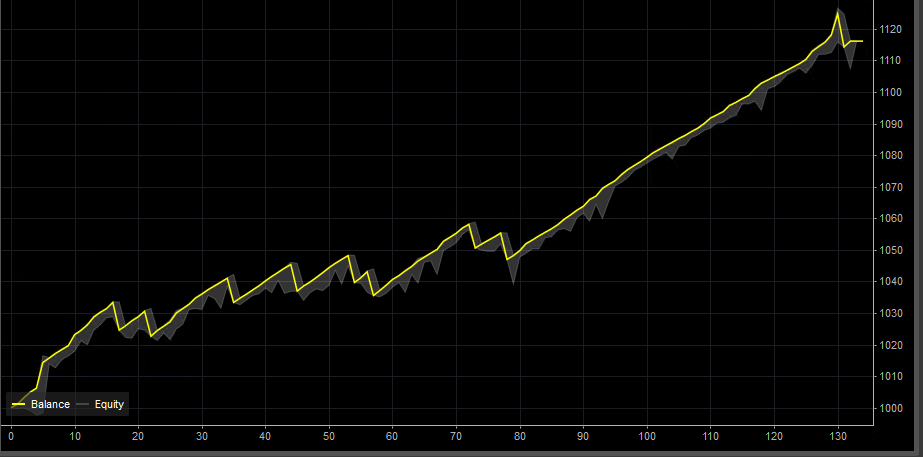
I like the results from this strategy better than the higher precision filter below even though it has several draw downs that reach nearly 2%. The less restrictive filter yielded 130 trades which is enough to start making a solid assertion for forward looking performance. With 130 trades the law of large #’s is working to our benefit.
This test was across a full year of tick data which is as much as cAglo will provide that crossed several Rise, fall macro trends so it should be pretty robust moving forward.
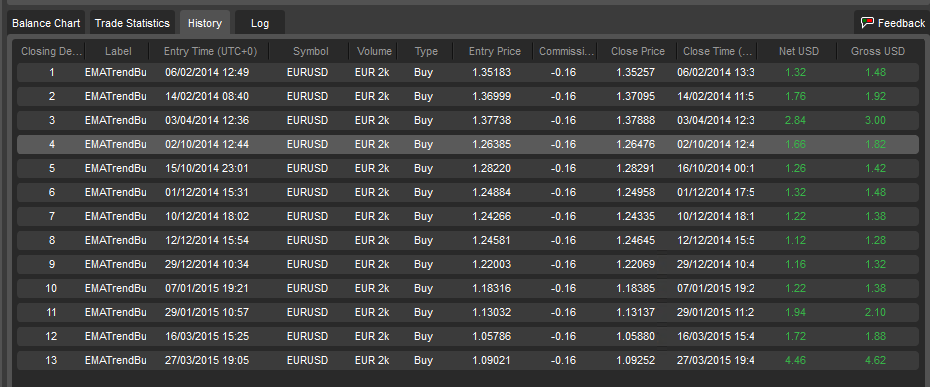
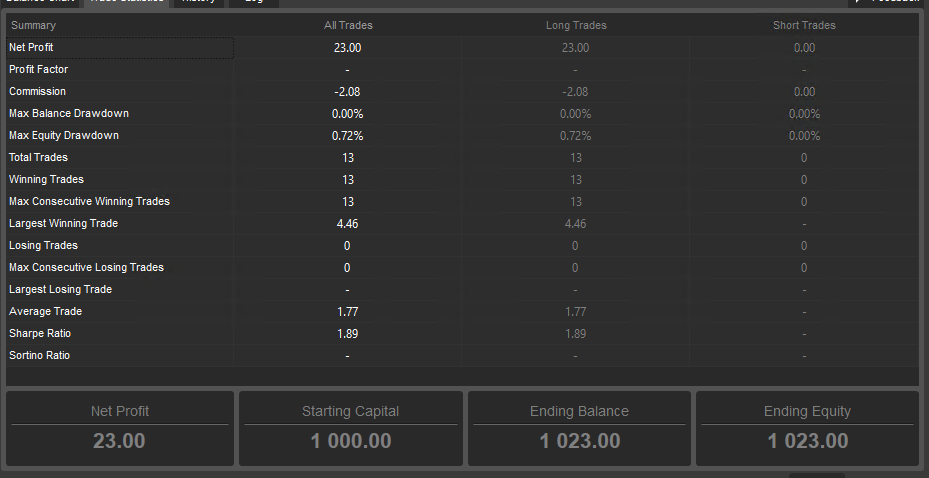
100% Correct (winning) but yields a lot Fewer Trades
To reach a higher accuracy for the same strategy configuration we changed a few filters that essentially tightened the filters to remove loosing trades. These filters also removed many trades that may have been profitable so it dropped from 130 trades down to 12 trades during the same time frame (Feb-2-2014 through April-05-2015)
Precision at Expense of Recall
I have seen this kind of trade off in nearly every stock or Forex prediction engine I have written. It seems like a general principal that attempts to improve precision (ratio of winning trades) tends to reduce recall (trading frequency). A non-intuitive side effect is that lower recall reduces our sample size which makes it harder to gain confidence using using the law of large numbers. Another non-intuitive side effect is that fewer trades have fewer opportunities to compound gains so in many cases the strategy which trades profitably more often but with a somewhat higher error rate will produce much higher net profit in many conditions.
The exception is when a strong filter can deliver enough trades to still benefit from the law of large numbers and compounding. Under those conditions Kelly betting rules allow a larger investment per trade.
Our goal as strategy designers is to find ways to increase precision with a minimum reduction in recall.
Take a look at the sharp ratio. This is one of the only times I have seen a Sharpe Ratio above 1 for a Forex account. Most of the more profitable strategies seem to run with Sharpe ratios between 0.2 and 0.3. Personally I would rather tolerate a lower Sharpe ratio for 5X higher ROI.
Law of Large Numbers is key
I believe the 132 trades above gives us a better feedback mechanism than the 13 trades even it it had made less money but this may not be intuitive. My assertion is that a success rate against a larger number of samples is more likely to yield a number that will accurately represent the forward looking prediction success rate provided we have similar trading conditions. Here is the logic I used to derive at this assertion.
The Law of large numbers states that if you know a given probability such as flipping a coin is 50% that if you flip a coin a infinite number of times you are guaranteed to converge to a 50% average results. Since we never have Infinite number of samples you can extend this to state that as your number of flips (sample) go up will very likely converge to the stated probability even without infinite flips. The entire Big Data business is predicated on a similar mind set where if you measure things enough times you can predict the outcome based on what you measured previously.
I extended this for our trading activities to states that if you trade a sufficiently larger number of times the overall win rate from those trades using identical decision criteria under similar market conditions it will give you a win rate that is quite likely to be similar to the expected results when trading against similar market conditions in the future.
I admit this is a weaker claim but we don’t need to be perfect we only need to be right often enough to pay off our trading costs and still deliver a positive ROI sufficient to justify risking our capital and time.
I acknowledge that future trading conditions will never be identical to past trading conditions but I don’t think this tells the entire story. I believe patterns do tend to repeat in ways that are similar enough to predict some future outcomes. The results from our Machine Learning prediction engine and our micro strategy test have produced results that indicate there is usable signal in the randomized price movement data. I believe that what we seeing is the effect from traders who doing very similar repetitive jobs many times per month who tend to use consistent approaches and processes to conduct their jobs. The repetition will inevitably introduce similar cycles which we see as things that look like noisy sine waves. We are essentially seeking to harvest the influences from those repetitive processes. Some traders will get smart and randomize their processes which is the main reason any micro-strategy without a ML component will need to be re-optimized periodically. We are not seeking 100% accuracy but we are seeking a statistical edge in what is supposed to be a random market that improves our prediction accuracy enough to allow us to make a sufficient net profit after trading costs that when measured across many trades will justify the time, energy and capital at risk.
When flipping a coin the long term average will converge towards 50% but the next 5000 flips could yield all heads. What the law promises is that as the number of samples rises the average will converge and will overwhelm the influence from a lucky run in the short term.
In trading it works similar but rather than flipping a coin we must predict when the price will move in the expected direction by a sufficient amount that we can exit the trade with a profit after paying our trading costs. We have to do this often enough that our net Wins yield sufficient net profit to justify risking our capital and Time. This is more challenging because even if you call the directional move correctly you can still loose money if you don’t exit at the right time. It is also complicated by the fact that trading tends to run in cycles where you have small cycles inside of mid size cycles inside of long term cycles so you need to have everything aligned to the cycle length you are trading.
A challenge with trading is that we don’t have an infinite number of trades to measure against. In addition as we attempt to increase the accuracy of predictions by setting more strict filters the number of trades we have available as samples drops which makes it harder to predict accurately. We are working against a anti-law which is that the higher precision we seek the smaller the sample size we have to work with so it takes longer to gain a confidence from the law of big numbers. In addition you may seem the trading conditions change to a different macro trend before you obtain a sufficiently large sample size. With this in mind we have to make decisions about how large a minimum is be considered large enough. Here are the baseline numbers I have been using:
5 samples – a hint especially if negative.
10 samples – beginning of good indicator for additional tests especially with over a 70% in either direction.
25 samples – indicator
50 samples – good indicator Sufficient to start live cash tests
100 samples – Strong indicator especially when obtained in periods over 100 days.
500 samples – a great indicator but difficult to obtain before macro market trends shift.
These are the sample sizes I use but it is important to remember that for each stage that the system advances through the test regime we always start skeptical and then ramp up exposure only as the system is proven in that stage. The risk levels are obviously specific to each user and there is always a trade-off between time consumed, learning rate and risk taking.
Stages of Test Back-testing to Live
No matter how well a strategy does during back-testing there is always a chance we have tied into special market conditions that may never repeat. To manage this risk we move each strategy through a series of stages with gradually increasing risk and stand ready to reduce the risk when a strategy starts to under perform.
One reason we back test so extensively is so we can gain a good feel for the draw down characteristics of a given strategy. The draw-downs will never be identical but if we see a strategy that never experienced more than a 8% draw-down or more than 5 consecutive loosing trades experience substantially greater failure rates it can be pulled back to lower risk even before it hits the formal risk management limits.
Each strategy is moved between these stages and if they start loosing more than back-tests indicate should be expected then exposure is reduced or they are moved back to an earlier stage of test.
These are the stages we use but each user must ultimately use their own process based on their time availability and risk tolerance.
- Back Test / Optimization – Looking for back-tests that show ability to meet profit goals in the target time frame while still remaining profitable or flat in next longer time frame. We are generally looking for strategy configurations yield favorable results with moderate draw-downs. We test these against an assumed 1,000 account with 1% of the capital at risk per trade but also test with 5%, 10%, 15%, 20% of capital at risk per trade. Testing with greater amounts of trade will help show which draw-downs are the most dangerous which can help focus efforts when optimizing. There will always be a trade off between
- Live Virtual Test – Trading with as close as we can get to live conditions with the same risk and draw-down rules. A strategy must test successfully in this mode before moving to the next stage. See: WFA below.
- Micro Live Cash Test – Risk less than $10 per trade with strict draw down. Optimize changes here. Looking for multiple weeks of a winning trade. We generally limit these to 1% of capital in micro accounts with less than $500. The main goal is to ensure the broker execution of live trades is close enough the virtual live accounts that the strategy produces very similar results or at least allow us to accommodate the difference. See: WFA below.
- Live Cash Test – This is the next stage of cash testing but is done with sufficient amount at risk to ensure the broker is not going to change the execution path or cause greater slippage. In this mode we tend to use accounts with $2500 limited to 3% at risk per trade and no more than a 18% draw-down for the account. We are looking for at least 60 days success but expect to re-optimize the strategy for the most recent time frames data at least once a week. See WFA below
- Trading for Profit – This is out ultimate goal where we will have in excess of $25K per sub account with between 1% and 15% of capital at risk at trade set using 1/2 Kelly based on the win rate from the last 10 trades or the last 50 trades which ever has the the lower win rate. We expect to re-optimize each of these strategies once per week but when we do so we place the new version back in live-cash-test and only advance it to replace the Trading for Profit version when it has out performed the prior version for the last week. If they drop below a given win rate they are moved back to micro-live-cash-test even earlier when macro market conditions change. My ultimate goal would be to have 80 or so strategies operating on different symbols simultaneously some short, some long so we are growing the ROI regardless of which direction the market is moving.
A key aspect of selecting the 80 is we want their entry decisions to be sufficiently different that their wins and losses are largely uncorrelated. In other words we do not want 50 out of 80 all deciding to buy the same symbol at the same time and all loose at the same time. Since the brokers limit the number of sub accounts we may have to group several strategy configurations in the same sub account.
In reality risk in this stage is increased over time as it is proven. We do not jump straight to our maximum exposure but would start at about 10% our planned maximum and ramp it up in stages over a period of weeks or months as it has been proven to deliver as anticipated. This ramp is considered the maximum and the Kelly sized bet is be adjusted as a portion of the current maximum exposure limit.
WFA (Walk Forward Analysis)
Robert Pardo describes a testing methodology called “WFA” or Walk Forward Testing in his book “Evaluation and Optimization of Trading Strategies“. WFA requires that the combination of Algorithm + Configuration parameters we call a strategy to be tested and optimized against one data set and then validated against a separate out of band data set. I agree with much of what Robert claims in the book and think it is well worth the investment. Robert discusses the difference between optimization and over fitting / over curve fitting in a very approachable way that every person thinking about automated trading should understand.
In this context the “Live Virtual Test”, “Micro Live Cash Test”, “Live Cash Test” are all forms of WFA. These are admittedly a primitive way to obtain WFA but in reality live trading using forward predictions are the only results most experienced practitioners trust. I have found that no matter what claims and design principals used to produce historical data testing that experienced practitioners only trust those that make predictions against current market data and are proven able to produce profitable results. The more strict practitioners also require that the forward tests agree with the predicted back tests within a given percentage of deviation. We use this stricter definition as a way to validate that our use of the “law of large numbers” is valid.
The “Back Test / Optimization” step above should be tested using a WFA concept simply by reserving a small amount of data at the end of the test cycle to test the most recent set of parameters against. To truly implement WFA in a profitable way you would actually choose a parameter set for a give period time reserving many weeks of data. You produce the best set of parameters you can find based on the training data and then test it against the next week of data you had reserved for future used by changing back-test dates. You then change the Back-test dates back to the training period but slide it one week forward re-optimize and then repeat the test using data from the following week. Simply repeat this process sliding forward one week at a time until you run out of reserved weeks. If the strategy and optimization process are robust this should produce good results over time even if any single week produced a loss. Unfortunately we have not found any software that fully supports this process so we had to write our own and it is CPU intensive. In the context of the micro-strategies this is a partially manual process and the future trading activities provide our next week but can generally be completed in a few hours per month although it can be addictive and consume hundreds of hours for those so inclined. Regardless of whether you choose a week, a day or 10 minutes as your sliding window the process remains the same. The amount of data used in your look-back window is a user preference a longer period of time tends to produce more robust strategies while shorter periods of time tend to produce higher profits but run a higher risk of losses when the market changes moods.
One miss in the book is that I have found testing strategies designed for a given macro trend during time periods where a different macro trend is active produces little value in a WFA context. It can add value by helping to identify the macro trends where a a given strategy is most compatible. This can help determine when to use or to avoid using a given strategy. It would be more efficient to focus specifically on investing more effort into finding and formalizing ways of detecting which macro trends a given strategy will perform well. The next obvious step is formalizing and automating the process of activating those strategies only during market conditions where they are most likely to perform well. This is not precluded by the book since you can consider a set of strategies with rules that activate only those that are a good match for current market conditions a macro strategy and you could apply most of the book to validating the macro strategy.
Never Believe that you can short circuit this process by taking a strategy optimized for the last 90 days and apply it to the prior 365 or prior X day period and expect good results. The same holds true when applied training and optimizing against the first 50% of the data applying the model to the last 50% of the data. This is a common mistake made by ML / AI advocates and inevitably produces bad analysis output. This mistake is very common for many trading practitioners. It can be confusing because the short circuit process can work for many domains where the physical laws remain constant but the market evolves, changes moods and macro trends change with the politics. Strategies have to adapt or they end up with a statistical samples that are correct over a longer period of time but worthless to predict the next move. Robert does cover this under a topic of using WFA to support rolling re-optimization with newer data to adapt to changing market conditions.
Robert did cover rolling re-optimization but failed to properly explain that if you are re-optimizing a strategy for the most recent data on a regular basis that you may and probably will see that configuration test poorly across longer time frames but that doesn’t mean a strategy should be abandoned. It is really a manifestation of a rule “You must choose a balance between optimal short term performance with more frequent re-optimization OR longer term stability with lower short term performance that tolerates less frequent re-optimization“.
My largest objection to his claims is that a given set algorithm + configuration should perform well against a wide range of market conditions. My testing has shown that while you can develop strategies that will perform robustly across a wider range of conditions they will never perform as well as those optimized to fit the current market conditions. Robert does soften this claim with a statement that different parameter optimization will be required for different markets. I think he confuses the principal that you have a Algorithm + a configuration which is a set a parameters that creates a strategy calls the Algorithm the strategy but this simply is not consistent with my observations from testing a wide range of algorithms a given algorithm can perform great or poorly depending on the parameters chosen so you really don’t have a strategy without the combination of the two.
The art in this instance is to recognize that market personalities change over time and most strategies will require periodic re-optimization to continue performing well. You can reduce the re-optimization by back-testing and optimizing across a wider range of market conditions but this inevitably comes at the expense of lower performance in any specific market conditions.
Our rule of thumb is that back-testing against 90 to 120 days of data for EURUSD FX when used against tick data execution and 1 minute bars. This seems to produce a nice balance between robustness and performance but it requires re-optimizing at once or twice a week where you drop off the older data and add the newer data. In the Machine Learning space we call this a continuous integration, Rolling optimization or evolving optimization. Unfortunately cAlgo and MetaTrader and no other platform we have found other than those we built from scratch support this kind of process in a fully automated fashion.
One reason we may move our Micro strategies from scripts to stand alone programs is to support this kind of optimization while consuming less human time. Incidentally this kind of optimization is highly CPU intensive and is the main reason we invest so much in very high performance indicator and back-test algorithms.
Robert claims to have invented the WFA methodology but it is nearly identical to a well accepted methodology for testing Machine learning and statistical classification systems that also requires training against portion of a data set while reserving other portions for test and validation purposes. I remember seeing the reserved test data in the AI literature during the 1980’s and I think WFA is really a restatement of that approach. It appears that WFA is really a manifestation of the Scientific process where you learn from past experiences and use that learning to propose new laws, new principals and new boundary conditions. You use these laws, principals and conditions to make predictions for the results of future experiments. If the results from the experiments agree with the predictions then they confirm the rule, laws, principals and boundary conditions. I would further assert that most practitioners trained in the hard sciences would naturally apply a similar process. I independently developed a similar process because it was the only one that made sense in changing market conditions. I strongly suspect that other engineers with a background in hard sciences would independently arrive at the same approach.
I think Robert should increase his coverage of the importance of human judgement when using automated ML optimizers. This is highly critical and may deserve a book of it’s own. The essence is that a human needs to choose a few parameters that at a macro level they are unwilling to change during optimization and then adjust all other parameters to find optimal performance settings with these held constant or at least held in a given range. This is the only way we have found to produce large numbers of configurations that yield uncorrelated trades and result in different entry and exit conditions. Otherwise the risk of converging to similar solutions is too high which limits the ability to scale the strategy to larger amounts of capital. An example of this phenomenon is that many of our optimizer approaches tend to converge for long positions at a 7 to 13 pip stop loss but while this does tend to best harvest micro-cycles it fails to capture the benefit of major moves across longer time frames. If we change this and force the stop loss to remain in a range between 27 and 50 pip then we see a fundamental shift in personality and the optimizer naturally moves to a much longer EMA for the long cycle EMA and increases the level at which we start tightening the stop losses. The net result is that the system moves from a 3 to 15 minute hold time with average gains of 5 pip to a 3 to 5 hour hold time with average gains over 25 pip and some gains over 80 pip. I view these parameters which are held constant as a form of a fundamental Assertion which are best made by experienced human traders based on a intuitive understanding of technical patterns. The rule of 90 to 120 days above changes depending on the hold time and can be used as one of the optimization parameters.
When using larger bars the amount of time needed in the optimization period rises. 90 days of 1 minute bar data yields about 86,400 bars and many times that many ticks. We have observed that that between 80,000 and 140,000 1 minute bars produce good statistical results. The accuracy seems to drop with larger numbers of bars for most statistical classifiers and the same rule seems to hold true for the micro-strategies. We have ideas about why this seems to be a sweet spot but we have not validated these ideas. One theory is that this is sufficient bars that Over fitting the curve with a limited number of parameters is nearly impossible simply because there is too much data to satisfy any simple curve. This means that settings that work are likely to be tied into reoccurring phenomena that are likely to continue reoccurring at least over the short term. It keeps the period short enough that you are working against the most current set of dominant macro trends rather than trading based on knowledge gathered from markets 3 years ago which are no longer valid due to changing market conditions. Our tests have indicated that you expect 1 to 3 weeks of good live results from a system well optimized against 90K bars and need to re-optimize based on the most current data before that time elapses. This time safe trading time frame can be shorter after a major market change that invalidates the current macro trend such as a significant change in Fed monetary policy and it is our suspicion that the best thing to do after major market / macro trend change points is to wait a week or two and re optimize before reactivating the strategy. This is an area where we think human judgement is an important aspect of the trading strategy.
Thanks Joe Ellsworth
CTO Bayes Analytic LLC
Contact Us
Required Disclaimer
Forex, futures, stock, and options trading is not appropriate for everyone. There is a substantial risk of loss associated with trading these markets. Losses can and will occur. No system or methodology has ever been developed that can guarantee profits or ensure freedom from losses. No representation or implication is being made that using this methodology or system or the information in this letter will generate profits or ensure freedom from losses. Forex and Option trading can result in losses that exceed the original principal balance.
Hypothetical or simulated performance results have certain limitations. Unlike an actual performance record, simulated results do not represent actual trading. Also, since the trades have not been executed, the results may have under-or-over compensated for the impact, if any, of certain market factors, such as lack of liquidity. Simulated trading programs in general are also subject to the fact that they are designed with the benefit of hindsight. No representation is being made that any account will or is likely to achieve profit or losses similar to those shown.
Even results from Live cash trading can be subject to specific market conditions that may not repeat in the future and as such, duplicate results from future trading is unlikely to duplicate past results. Changing the dollar amount traded can cause different behavior in live trading markets especially when trading large positons that can exceed the liquidity available in the market and cause changes in pricing behavior.
Bayes Analytic LLC provides software that can produce trading signals. The customer is responsible for choosing a configuration and parameters for the software that meets their own goals. The customer is responsible for conducting their own tests and only the customer can activate the software to start trading. The software runs in an account the customer has logged into and then activated the software. Bayes Analytic has no control of, influence over or visibility to the signals specific to given user because we have no visibility into configuration parameters the user has chosen to operate with. The Bayes Analytic software is provided without Warranty on a As Is, Where is basis. It is the customers responsibility to test the software to ensure it meets their trading requirements. Every time Bayes Analytic releases a new version of the software the customer should conduct new tests to validate the new version continues to meet their requirements because every software change could have unexpected side effects that may not be obvious until the customer has tested it in their environment with their configurations. The Bayes Analytic software may run as a script inside of other software packages or talking to API that Bayes Analytic has no control of or Influence over so the customer should test entire ecosystem to ensure it meets their trading requirements. Bayes Analytic may provide the software in source form since that is required by some trading systems but it remains the exclusive copyrighted property of Bayes Analytic and may not be reverse engineered or redistributed. The customer is responsible for choosing their own broker and installing the Bayes Analytic software so it can trade using the desired account. Bayes Analytic has no control over or influence of the broker and many brokers have different ways of quoting spreads, charging commissions, flow of orders and latency of information. As such a strategy and software that performs well at one broker may and probably will require changes to perform well at other brokers. It is the customers responsibility to test the software with their selected broker to ensure it meets their trading requirements.
Well, if there is a higher winning percentage, could you not increase the trade size? That would leave more (and in theory, infinitely more) profits.
Yes but a large amount of success in any trading system is managing capital at risk. See our other articles Kelly betting system.
Hello Joe, I actually read this write up from you on LinkedIn before you sent it to be. Excellent job in this, I know it took some time. You should get some positive feedback from this, it’s one of the most informative articles that I’ve read in a while.
Your advice on things that where helpful versus what could have been omitted would be most appreciated. Was it helpful because you have been trained on the mini strategy or as a stand alone article.
To be perfectly honest with you, I went into reading the article as if you and I never came across one another. Totaly unbiased. With that said, I strongly feel you should get some excellent feedback. CM
Nice one. I completely agree. It’s not just about the accuracy. If accuracy improves at the expense of profitability there is no point. Once way to make that happen is to keep the profit target and stop loss the same. This implies that a higher accuracy would actually translate to higher profits. But yes. Draw-down characteristics and other performance parameters have to be acceptable.
I will not recommend keeping identical target and stop loss for all styles of trading in the production environment. If you are using trend following driven strategies, this will hurt.
What I recommended was to keep identical stop loss and target to check the accuracy and see if it is better than a coin toss. You may still use a higher target and lower stop loss for trend following strategies.
Bharath
Actually I tried keeping the profit and stop loss configuration identical when I changed the filters and it still resulted in lower profits. The lower profits are caused by executing fewer trades due to more strict filters. Even though we had a higher win ratio we lost many winning trades too. Whenever we changed the filters in ways that eliminated some of the loosing trades it also suppressed many winning trades and ultimately this was enough to reduce the profit even when the accuracy increased. The holy grail is to find a algorithm that could filter out all the bad trades and keep all the good trades but I have not found it. I think it will always be a balancing act to keep as many good trades as possible while keeping the maximum draw-down reasonably low.
Thanks Joe E.